
写在前面
之前部署了Prometheus 来监控MongoDB和Redis集群,但是对MongoDB能监控的项目不是很全面,包括监控节点是否存活,集群运行状态等等,找了一下其他的解决方案也不适用我这里的生产环境,现阶段只能通过检测端口来判断节点是否存活
部署黑盒
本来打算还是通过Docker部署,但是没有找到好一点的镜像,就改为从官方下载程序然后托管到系统运行
#创建并切换目录
mkdir -p /opt/install
cd /opt/install
#下载源码文件
wget https://github.com/prometheus/blackbox_exporter/releases/download/v0.21.0/blackbox_exporter-0.21.0.linux-amd64.tar.gz
#解压文件
tar zxvf blackbox_exporter-0.21.0.linux-amd64.tar.gz
#创建systemctl控制文件
vim /lib/systemd/system/blackbox_exporter.service
#加入以下内容(注意路径)

[Unit]
Description=blackbox_exporter

[Service]
User=root
Type=simple
ExecStart=/opt/install/blackbox_exporter/blackbox_exporter --config.file=/opt/install/blackbox_exporter/blackbox.yml
Restart=on-failure
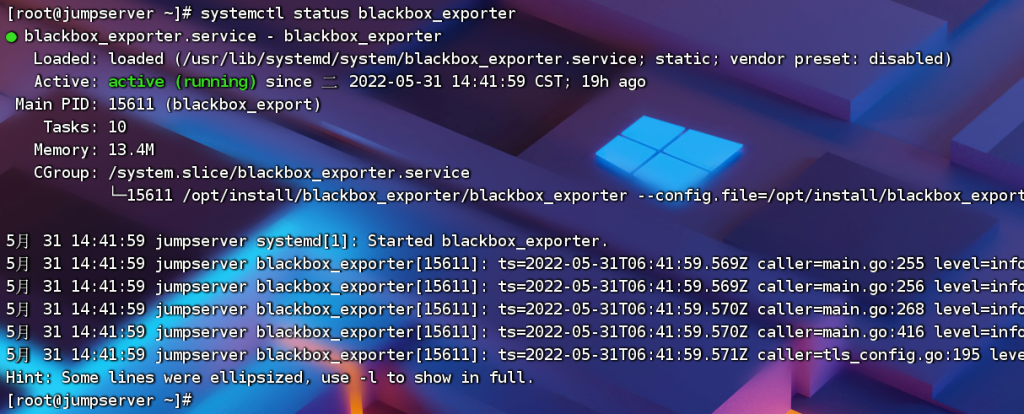
接着我们查看是否可用
#上面的命令运行完成如果没有报错,表示配置文件写的正确
systemctl status blackbox_exporter
#接着我们配置开机自启动并启动
systemctl enable blackbox_exporter
systemctl start blackbox_exporter
#查看运行状态
systemctl status blackbox_exporter
程序运行起来后,去修改Prometheus 的相关配置文件
修改Prometheus 配置文件
找到之前的Prometheus 配置文件并增加以下内容
vim /opt/yaml/prometheus.yml

#增加配置,注意和前面的配置一样保持缩进
- job_name: 'port_status'
    metrics_path: /probe
    params:
      module: [tcp_connect]
    static_configs:
      - targets: ['172.18.66.165:28017','172.18.66.165:27018','172.18.66.165:27017']
        labels:
          instance: '172.18.66.165'
      - targets: ['172.18.66.166:28017','172.18.66.166:27018','172.18.66.166:27017']
        labels:
          instance: '172.18.66.166'
      - targets: ['172.18.66.171:28017','172.18.66.171:27018','172.18.66.171:27001']
        labels:
          instance: '172.18.66.171'
   relabel_configs:
      - source_labels: [__address__]
        target_label: __param_target
      - source_labels: [__param_target]
        target_label: instance
      - target_label: __address__
        replacement: 172.18.66.178:9115 #blackbox默认端口就是9115
Prometheus配置文件修改完成以后,新增报警配置文件
#新增一个配置文件,并加入内容
vim /opt/rules/port.rules

groups:
- name: blackbox_network_stats
  rules:
  - alert: 'MongoDB端口探测失败'
    expr: probe_success == 0
    for: 60s
    labels:
      severity: high
      alertinfo: push_blackbox_alert
    annotations:
      summary: "{{ $labels.instance }}探测失败"
      description: "MongoDB端口探测失败,请检查业务是否正常!!!"
接着重启Prometheus容器
#重启容易,注意容器名字可能和我的不一样
docker restart prometheus-one
#查看容器运行状态
docker inspect prometheus-one
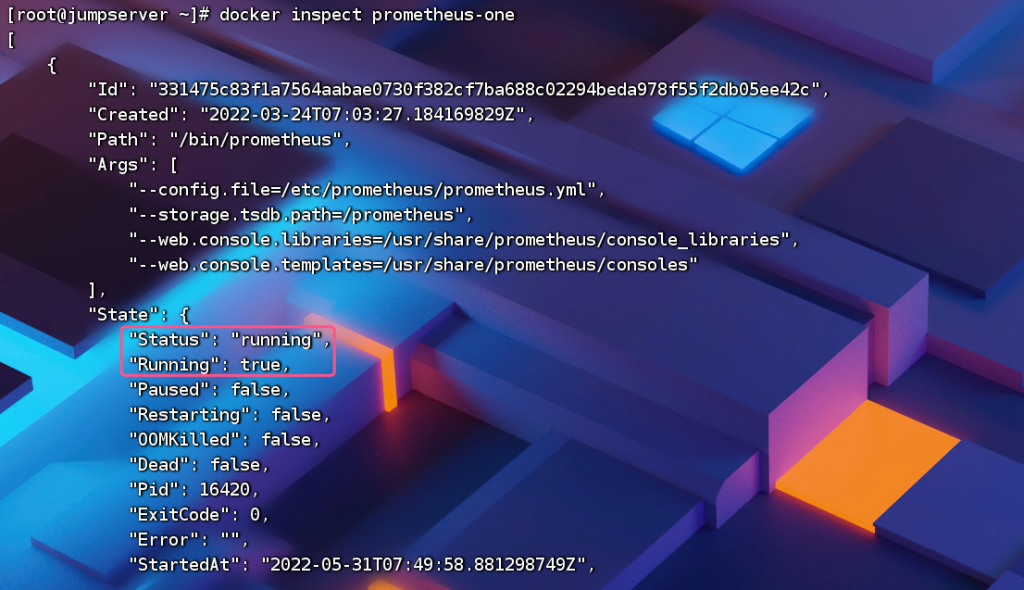
运行正常的话就可以通过web界面查看规则是否启用了
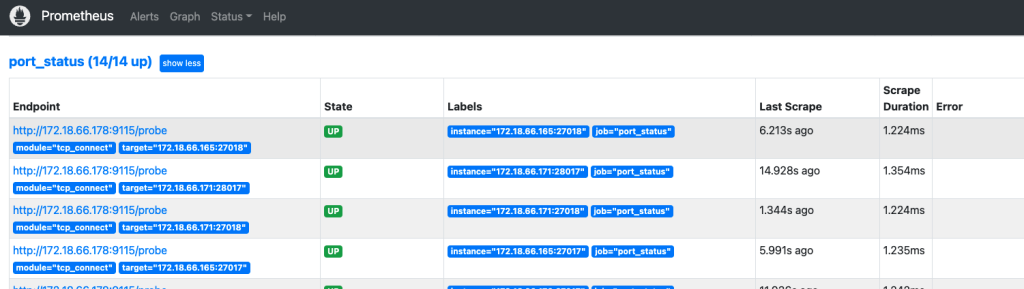
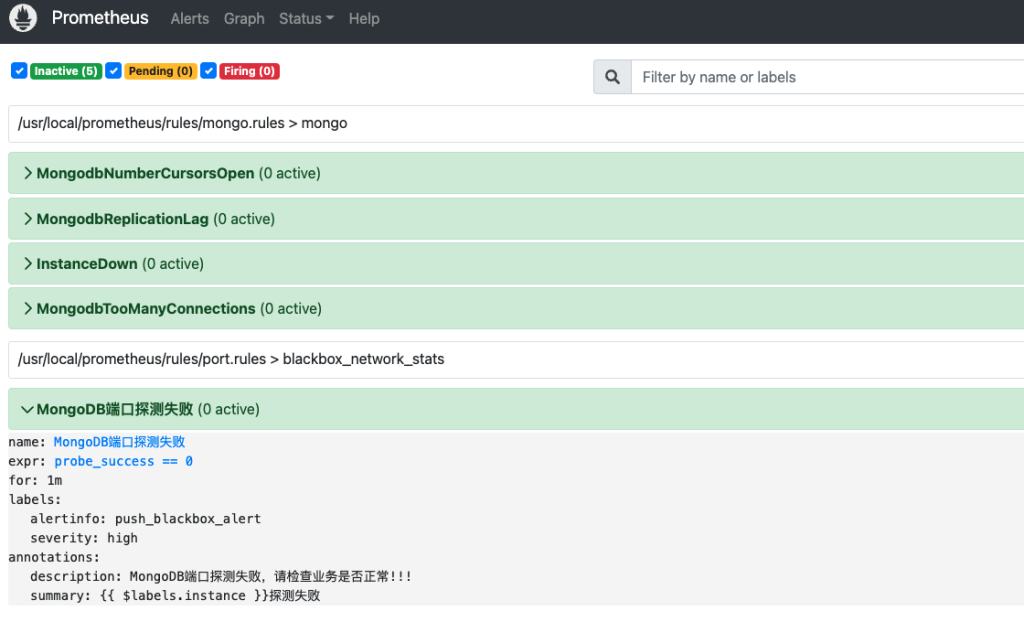
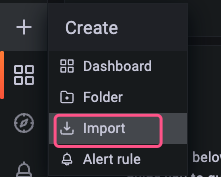
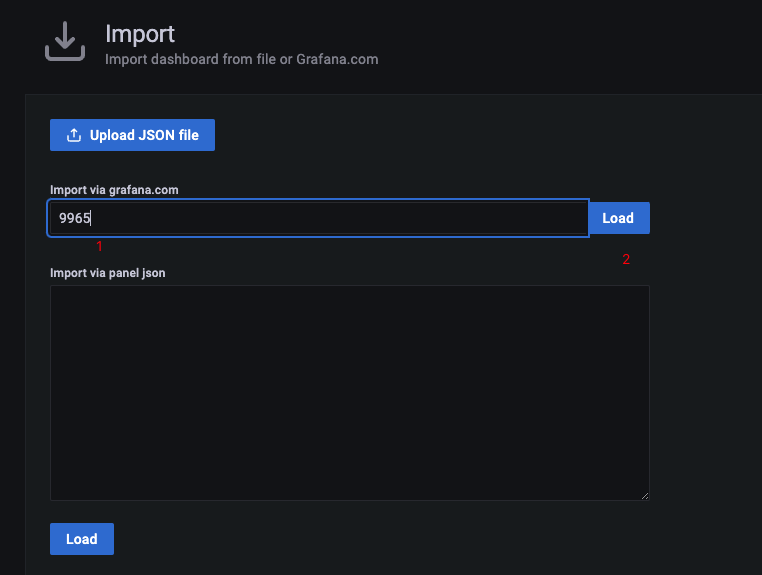
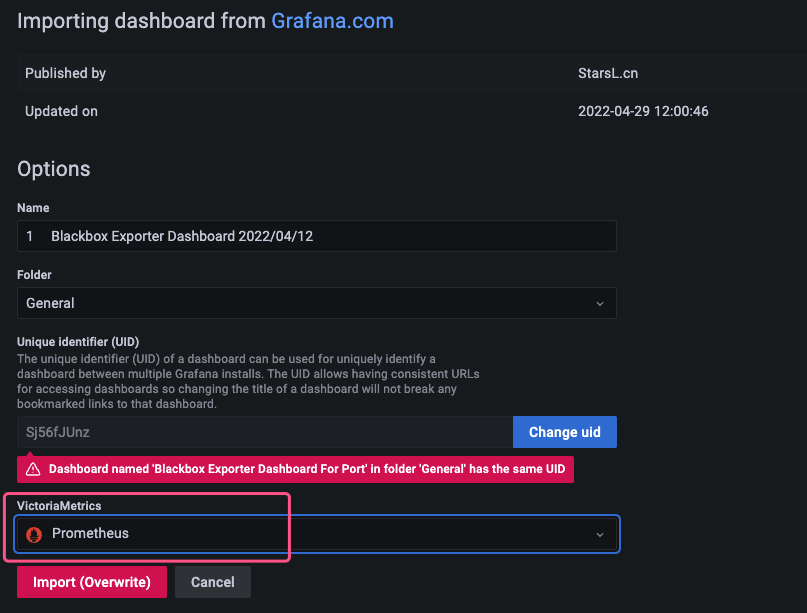
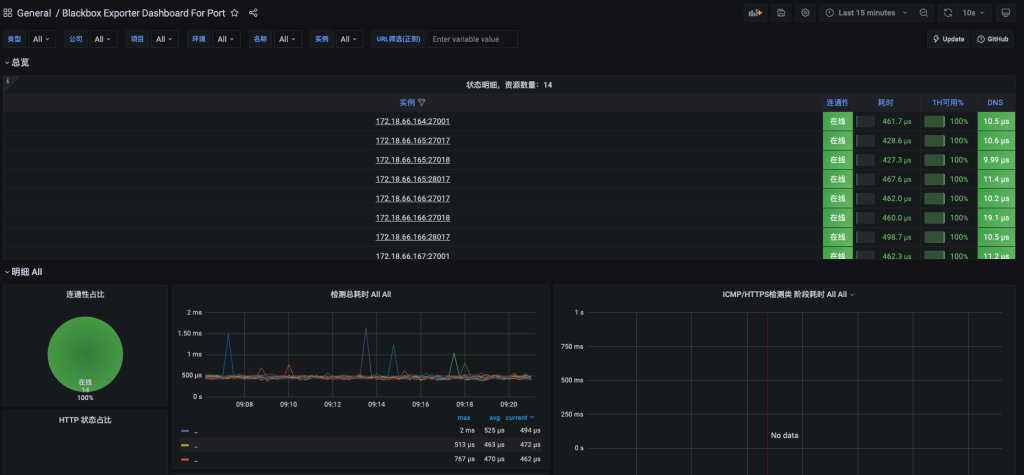
可以看到探测和报警都已经添加成功,还可以增加Grafana的数据面板方便查看
其实黑盒不止可以监控端口,还可以通过ping和http探测服务或服务器是否存活
#下面是模版配置,在Prometheus配置文件增加相应内容即可

   # 网站监控
  - job_name: 'http_status'
    metrics_path: /probe
    params:
      module: [http_2xx]
    static_configs:
      - targets: ['<http://www.baidu.com>']
        labels:
          instance: http_status
          group: web
    relabel_configs:
      - source_labels: [__address__]
        target_label: __param_target
      - target_label: __address__
        replacement: 172.18.66.178:9115

   # ping 检测
  - job_name: 'ping_status'
    metrics_path: /probe
    params:
      module: [icmp]
    static_configs:
      - targets: ['192.168.31.62']
        labels:
          instance: 'ping_status'
          group: 'icmp'
    relabel_configs:
      - source_labels: [__address__]
        target_label: __param_target
      - target_label: __address__
        replacement: 172.18.66.178:9115

   # 端口监控
  - job_name: 'port_status'
    metrics_path: /probe
    params:
      module: [tcp_connect]
    static_configs:
      - targets: ['192.168.31.62:80']
        labels:
          instance: 'port_status'
          group: 'port'
    relabel_configs:
      - source_labels: [__address__]
        target_label: __param_target
      - target_label: __address__
        replacement: 172.18.66.178:9115